Monitoring and reporting Amazon FSx user access events using Splunk
With file access auditing, customers can send access audit logs to Amazon CloudWatch Logs or stream them to Amazon Kinesis Data Firehose enabling log archiving, log analytics, and event-based actions. This allows customers to automate monitoring of and reacting to user activity in near-real time by using AWS services such as AWS Lambda or AWS Partner solutions like Splunk. To meet compliance objectives, organizations need to know and demonstrate who is accessing, and what actions are performed on, files, folders and file shares. File access auditing can be used to validate the access control rules that have been defined for access to protected data.
In this blog post, I use Amazon Kinesis Data Firehose to deliver end-user access audit events from Amazon FSx for Windows File Server to Splunk Enterprise and demonstrate how to:
- Configure Splunk to act as a destination for Amazon FSx for Windows File Server audit events streamed to Kinesis Data Firehose.
- Enable file access auditing for Amazon FSx for Windows File Server and configure it to stream audit events to Splunk using Kinesis Data Firehose.
- Query the log data in Splunk for user accesses and present the results in a Splunk dashboard.
Overview of file access auditing
Amazon FSx for Windows File Server provides a fully managed, highly reliable, scalable file storage built on Windows Server that is accessible over the industry-standard Server Message Block (SMB) protocol.
File access auditing on Amazon FSx for Windows File Server can be turned on during or after the creation of a file system via the AWS Management Console, the AWS CLI, or API. File access auditing for Amazon FSx enables you to log end-user accesses for individual files, folders, and file shares. For file, folder, and share accesses you can define which attempt types (success only, failure only, or both) are logged. Learn more about file access auditing in the documentation.
Audit controls, also known as System Access Control Lists (SACLs), define which access types and for which users or groups to publish audit events. SACLs are used to apply Access Control Entries (ACEs) to file system objects, such as files and folders. The ACEs are used to determine whether to record a successful or failed user access attempt to a file system object depending on the permissions applied to the object. Audit controls (SACLs) are configured using the Windows File Explorer or programmatically using PowerShell.
CloudWatch Logs and Kinesis Data Firehose for file access audit events
With file access auditing for Amazon FSx for Windows File Server, you can deliver logged events to Amazon CloudWatch Logs or Amazon Kinesis Data Firehose. Both services provide the benefits of fast delivery and aggregation of logs from multiple file systems in one place.
CloudWatch Logs provide an easy way to collect and analyze events, and they give administrators the ability to search for event codes and trigger security notifications based on search patterns. On the other hand, Kinesis Data Firehose provides a reliable service to capture, transform, and deliver events to multiple persistent storage destinations such as Amazon S3, Amazon Redshift, and Amazon Elasticsearch Service. Kinesis Data Firehose also allows you to deliver events to service providers like Datadog, New Relic, MongoDB, and Splunk.
Configuring an HTTP Event Collector (HEC) on Splunk Enterprise
Step 1 – Configure Splunk HEC global settings
Streaming data to Splunk requires setting up the HEC. An HEC provides a fast and efficient way to send data over HTTP or HTTPS directly to a Splunk Enterprise deployment or to the Splunk Cloud. In order to use an HEC on Splunk Enterprise, you must enable it through the Global Setting dialog box. With Splunk Cloud, the HTTP Event Collector is enabled by default but you need to file a ticket with Splunk Support to enable HEC for use with Amazon Kinesis Data Firehose.
Log in to Splunk using the URL for your deployment; the default port is 8000 (http://<hostname>:port).
- Select Settings, then Data Inputs from the top-right menu.
- Select HTTP Event Collector.
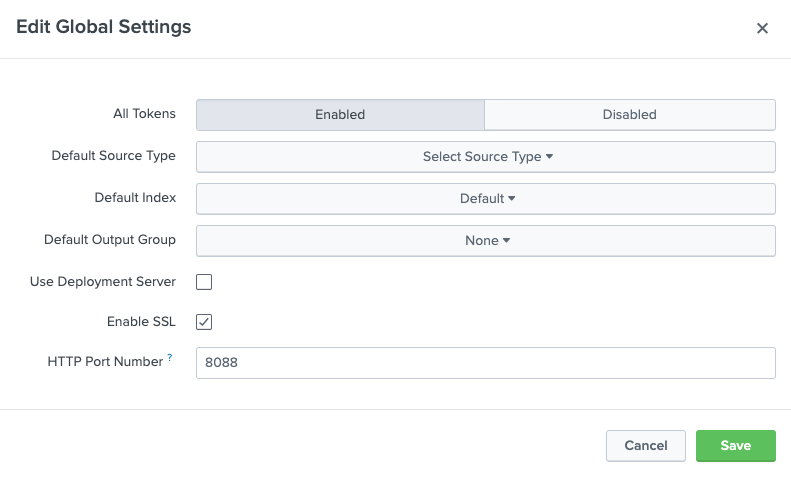
- Select Global Settings.
- In the All Tokens toggle button, select Enabled.
- To have HEC listen and communicate over HTTPS rather than HTTP, select the Enable SSL check box. Kinesis Data Firehose requires HTTPS.
- (Optional) Enter a number in the HTTP Port Number field for HEC to listen on.
Confirm that no firewall blocks the port number that you specified in the HTTP Port Number field, either on the clients or the Splunk instance that hosts HEC. - Click Save.
Step 2 – Create a Splunk index for Amazon FSx for Windows File Server events
You can separate the file access auditing for Amazon FSx events from other events delivered to the Splunk deployment by creating a new index (fsx-faa). Splunk Enterprise stores the data it processes in indexes.
- Select Settings, then select Indexes.
- On the top-right corner click on New Index.
- Enter an Index Name.
- Leave the default settings and click on Save to create index.
Step 3 – Create an Event Collector Token on Splunk Enterprise
To use a HEC, you must configure at least one token. Log in to Splunk Web and complete the following instructions to create an event collector token:
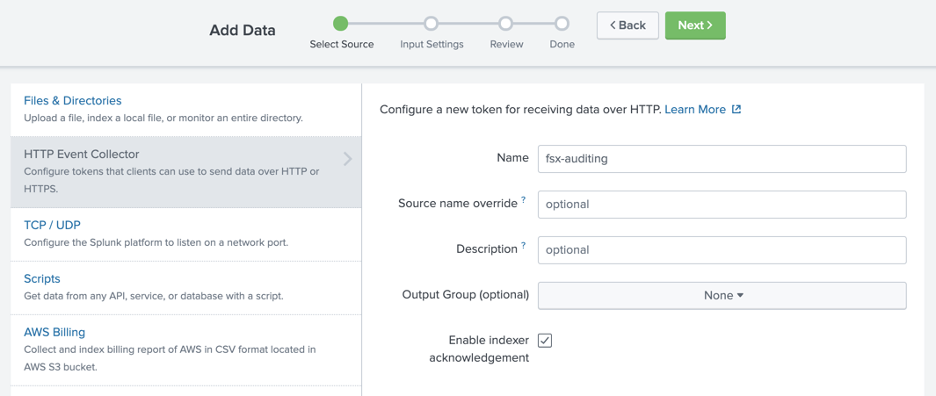
- Select Settings, then Add Data.
- Select monitor, and choose HTTP Event Collector.
- In the Name field, enter a name for the token.
- Enable indexer acknowledgment for this token, click the Enable indexer acknowledgment check box.
- Select Next and then Review.
- Confirm that all settings for the endpoint are what you want.
- If all settings are what you want, select Submit. Otherwise, go back to make changes. Copy the token value that Splunk Web displays and paste it into another document for reference later.
After enabling the Splunk HEC and creating a new token, you can then create a Kinesis Data Firehose delivery stream to send data to the Splunk HEC.
Configuring Kinesis Data Firehose delivery stream with Splunk
Delivery Streams configured to use Splunk HEC require an SSL enabled endpoint. The endpoint is terminated with a valid CA-signed certificate that matches the DNS hostname of the HEC. Log in to the AWS Management Console, search for Kinesis in the main search box and select Kinesis.
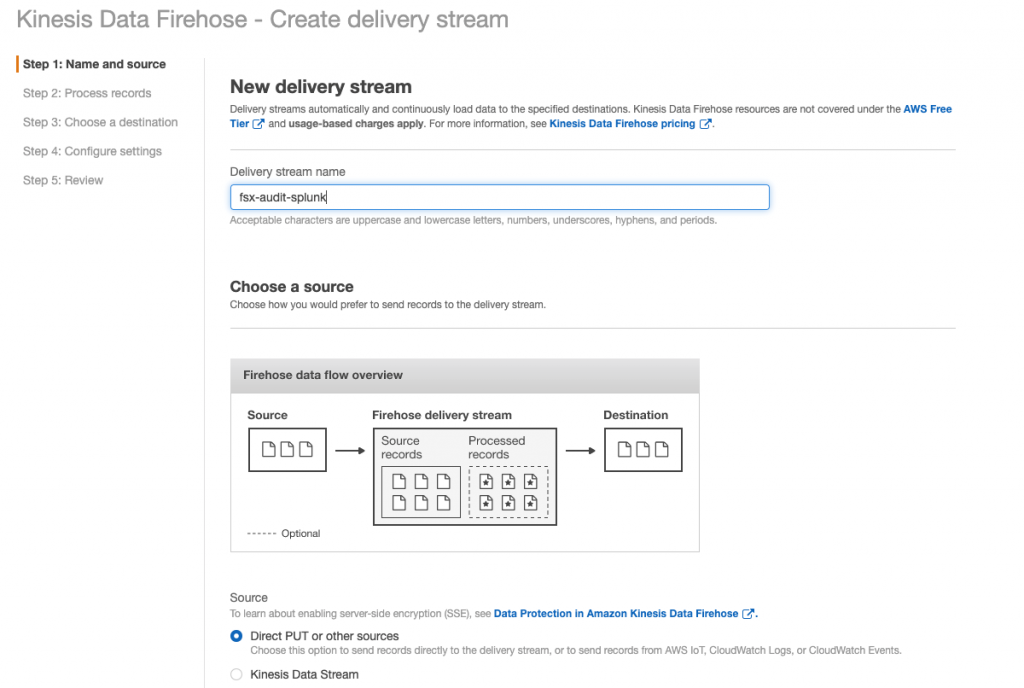
- On the Get started section select Kinesis Data Firehose and click on Create delivery stream, or click on Create delivery stream in the Kinesis Data Firehose section of the Kinesis dashboard.
- Provide a Delivery stream name, in this format:
aws-fsx-xxxxxx, for exampleaws-fsx-splunk. - Select the Source check box for Direct PUT or other sources and click Next.
- Click Next to Choose a destination. For Destination, choose Third-party service provider, and from the Third-party service provider dropdown list, select Splunk.
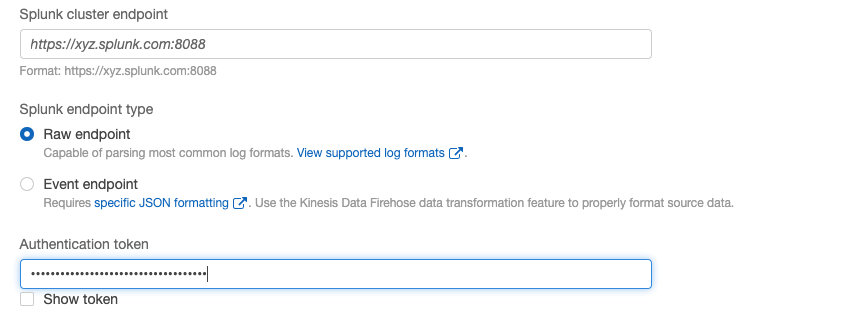
- Provide the Splunk cluster endpoint, choose a Raw endpoint The HEC endpoint port was provided in Configure Splunk HEC Global Settings – Step 1, task 10.
- Enter the Authentication token created from Configure Splunk HEC Global Settings – Step 3.
- Choose an S3 bucket for S3 backup for failed events delivery, enter a prefix to append to delivered objects, then select Next.
- Enable Error logging to CloudWatch Logs.
- Select Choose and existing IAM role or allow a role to be automatically created with Create or update IAM role, then select Next.
- Review the configuration details and click on Create Delivery Stream.
Configuring access auditing for Amazon FSx for Windows File Server
You can enable access auditing when creating a new file system or by updating file systems. For existing file systems created before the launch of file access auditing for Amazon FSx, create a file system backup and restore to a new file system to enable file access auditing. To create a new file system, follow the steps outlined in the Amazon FSx documentation and modify the audit configuration sections as shown in the following steps. To enable auditing, the file system throughput capacity must be set to 32 MB/s or greater.
Step 1: Enable file access auditing
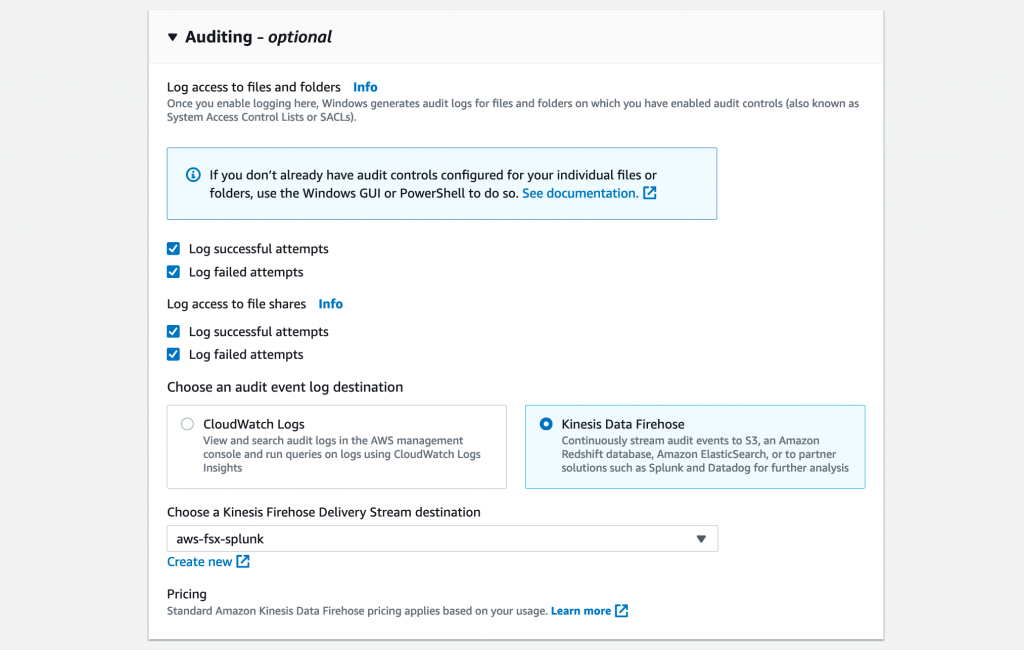
- During file system creation, expand the Auditing – optional section. To update an existing file system, click on the File system name, go to the Administration tab and click on Manage.
- Choose logging settings for Log access to files and folders. Click on Log successful attempts and/or Log failed attempts.
- Choose logging settings for Log access to file shares. Click on Log successful attempts and/or Log failed attempts.
- Click on Kinesis Data Firehose as the audit event log destination. From the dropdown list, choose a Delivery Stream destination. Supported delivery streams are required to be in the
aws-fsx-*namespace for Kinesis. - Select Next to review the file system details, then select Create File System (select Save to update an existing file system).
Step 2: Set audit controls on the files and folders
With auditing enabled on the file system, the next step is to enable audit controls on the files and folders that you want to audit for user access attempts.
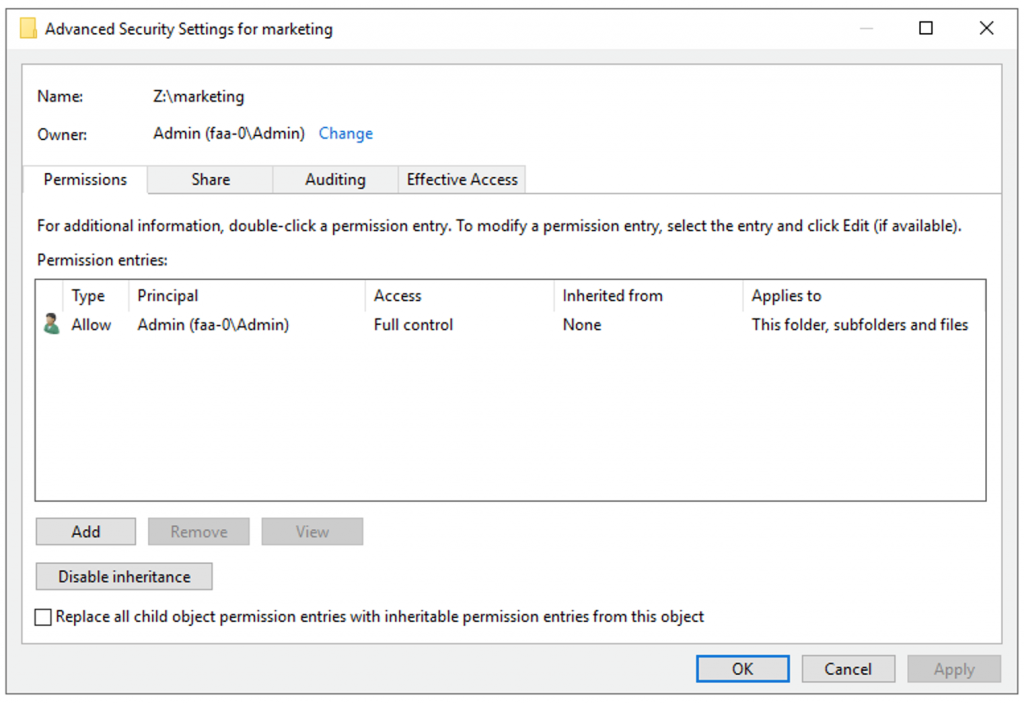
- Using the Windows File Explorer GUI right-click on the file or folder you want setup audit controls.
- Select Properties, then Security, then Advanced, and then finally go to the Auditing
- Select Add:
- Select a Principal, for example, specific users or groups that you want to audit. For all users select Everyone.
- Select a Type (that is, Success, Fail, All).
- Choose what the entry applies to (that is, This folder, subfolders and files).
- Select Basic permission (that is, Full control, Read and execute, etc.) Select Show advanced permissions to customize permissions.
- Select
- Select Apply then OK.
Splunk search and reporting on Amazon FSx for Windows File Server audit logs
To simplify the search queries, you can install the Splunk add-on for Microsoft Windows. The add-on automatically selects and tags fields, making searches more efficient.
- Go to the Splunk console, select +Find More Apps, then Search for “Add-on for Microsoft Windows.” Select Install and then enter your Splunk.com user name and password, accept the EULA conditions, then log in and install.
- Change the HEC source type to a Windows Event Log source type from the add-on for Microsoft Windows. Go to Settings, then select Data inputs, and choose HTTP Event Collector. Select the HEC name created in Configuring an HTTP Event Collector (HEC) on Splunk Enterprise – Step 3.
- From the Source Type dropdown list search for XmlWinEventLog:Security and select it.
- From Select Allowed Indexes select the index created in Configuring an HTTP Event Collector (HEC) on Splunk Enterprise – Step 2.
- Save the changes.
Next, you’ll want to ensure that each audit event is parsed in Splunk as a unique event. Without providing a custom configuration (props.conf), Splunk will not split a single file access auditing event into separate events. Note that there is no Terminal/SSH access to Splunk Cloud deployments and this custom configuration can only be performed on Splunk Enterprise deployments.
- Connect to the Splunk parsing server(s), heavy forwarders and indexers, via SSH or Remote Desktop.
- Add the following lines to the
/$SPLUNK_HOME/etc/system/local/props.conffile. Create the file if it doesn’t exist.
[XmlWinEventLog:Security]
CHARSET=UTF-8
LINE_BREAKER=([rn]+)<Eventsxmlns
SHOULD_LINEMERGE=false
category=Custom
description=tested for xml test file
disabled=false
pulldown_type=true
- Restart the Splunk server via the Splunk console (Setting > Server Controls > Restart Splunk) or via the server CLI (
sudo /$SPLUNK_HOME/bin/splunk restart).
Before starting a search, first verify that events are being delivered to the Splunk HEC. Go to the Splunk console. In the console, go to Search and Reporting and search for events delivered to the file access auditing index created in Configuring an HTTP Event Collector on Splunk Enterprise – Step 2.
index="fsx-faa"
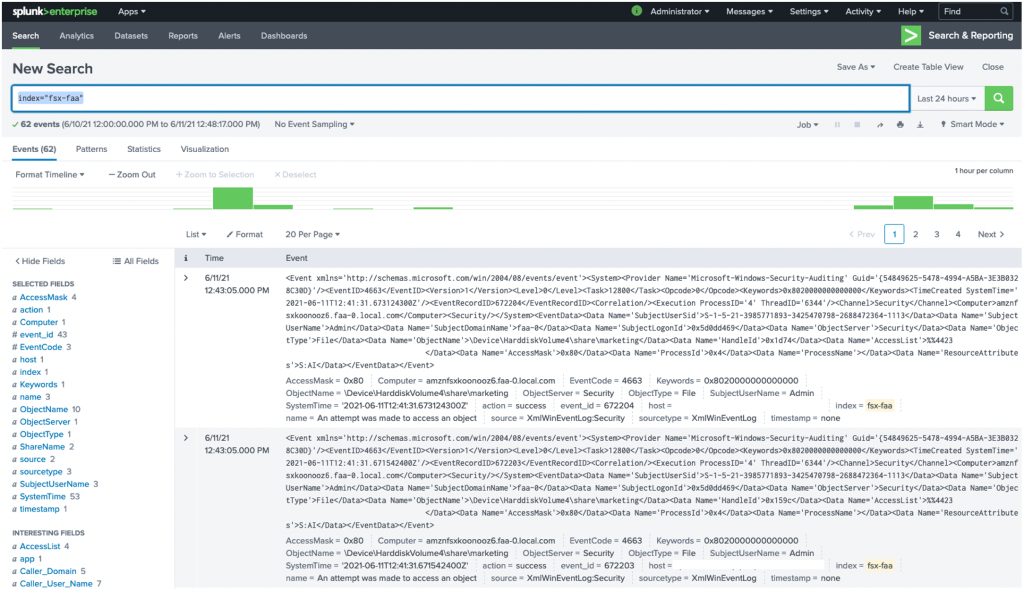
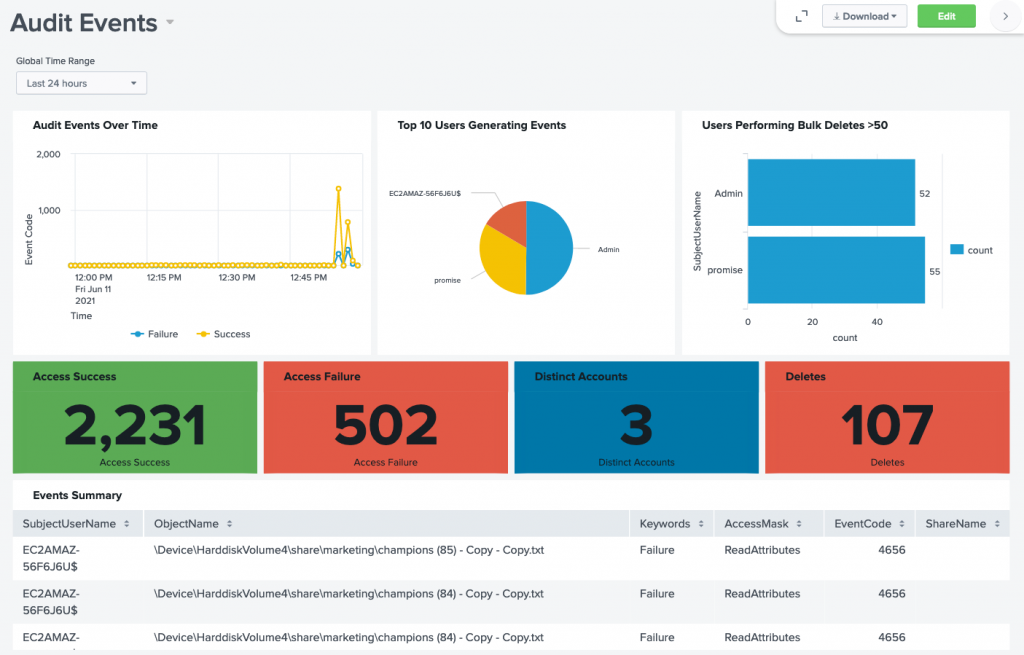
Having confirmed that events are being delivered successfully, let’s build a sample dashboard that will display the following details:
- Success and Failure file access events over time
- Users performing bulk deletes (> 50 deletes in the last hour)
- Top 10 users generating audit events
- Count of delete accesses
- Count of failure accesses
- Count of success accesses
- Count of distinct number of users
- Table showing file access summary, that is, user name, file or folder, success or failure, accesses and event codes, share name
Relevant fields are automatically extracted by the Splunk add-on for Microsoft Windows and displayed on the left side of the search console. You can leverage these fields (AccessMask, Keywords, EventCode, SubjectUserName, ObjectName) for the search queries used to create the dashboard.
The first two search queries in the list below use the EventID codes 4659 and 4660. The 4659 EventID code is generated when a handle to an object was requested with intent to delete, while the 4660 code is generated when an object was deleted. Refer to Microsoft documentation for further details on file system events and file share events.
Go to the Splunk Enterprise console and click on Search & Reporting from the Apps list on the left-hand side. Enter the following search queries in the search field:
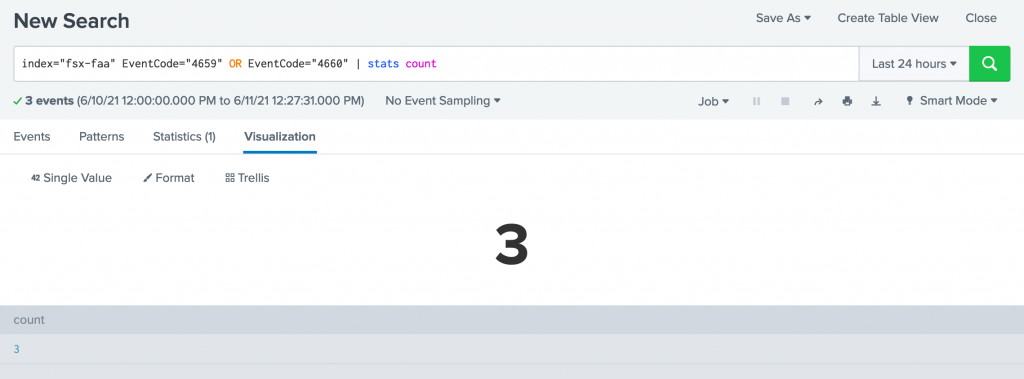
- Count of deletes:
index="fsx-faa" EventCode="4659" OR EventCode="4660" | stats count
- Users performing bulk deletes >50:
index="fsx-faa" EventCode="4659" OR EventCode="4660" | stats count by SubjectUserName | where count > 50
- Distinct users accessing data on the file share:
index=="fsx-faa" | stats dc(SubjectUserName)
- Count of successful access events:
index="fsx-faa" Keywords=0x8020000000000000 | stats count
- Count of failed access events:
index="fsx-faa" Keywords=0x8010000000000000 | stats count
- Audit events over time:
index="fsx-faa" | replace "0x8010000000000000" with "Failure", "0x8020000000000000" with Success | timechart count by Keywords
- Top 10 users generating events:
index="fsx-faa" | table SubjectUserName | top limit=10 SubjectUserName
- Event summary:
index="fsx-faa" | table SubjectUserName,ObjectName,Keywords,AccessMask,EventCode,ShareName |
replace "0x1" with "ReadData (or ListDirectory)", "0x2" with "WriteData (or AddFile)",
"0x4" with "AppendData", "0x8" with "ReadEA", "0x10" with "WriteEA", "0x20" with "Execute/Traverse",
"0x40" with "DeleteChild", "0x80" with "ReadAttributes", "0x100" with "WriteAttributes", "0x10000" with "DELETE",
"0x20000" with "READ_CONTROL", "0x40000" with "WRITE_DAC", "0x80000" with "WRITE_OWNER", "0x100000" with "SYNCHRONIZE",
"0x1000000" with "ACCESS_SYS_SEC", "0x8010000000000000" with "Failure", "0x8020000000000000" with Success
After each search result is returned, go to the Visualization tab and select Single Value from the Select visualization options for Deletes, Distinct Accounts, Access Failures, and Access Success. Select Pie Chart for Users Performing Bulk Deletes, Bar Chart for Users Performing Bulk Deletes >50 and Line Chart for Audit Events Over Time.
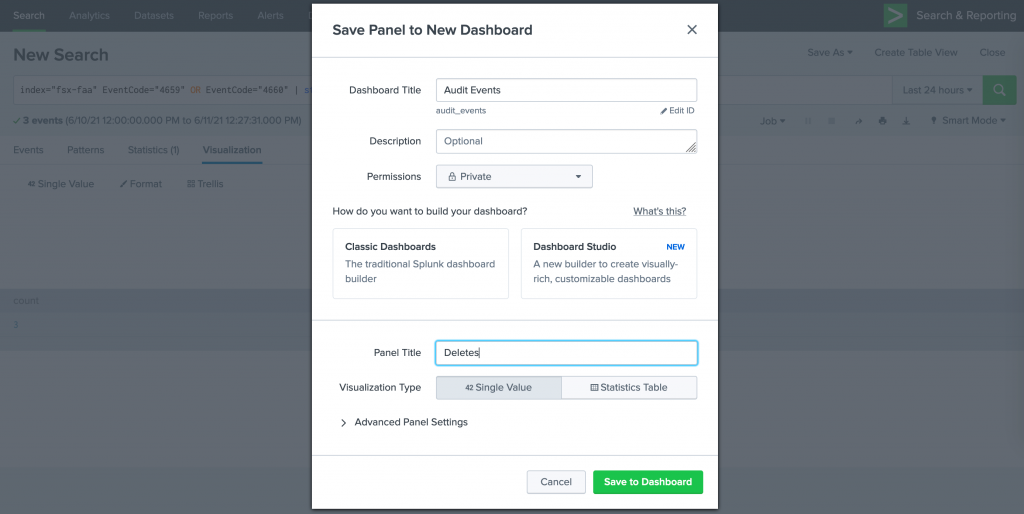
Add the visualization to a dashboard by going to the Save As dropdown menu, select New Dashboard, enter a Dashboard Title and a Panel Title for the search result, and Save to Dashboard. After creating the dashboard for the first visualization, add subsequent visualizations to the same dashboard. First select Save As, then Existing Dashboard, then choose your existing dashboard name and enter a Panel Title, then finally Save to Dashboard.
Access the dashboard by going to Dashboards and select the dashboard created from the list. Edit the dashboard with the green Edit button, and move and resize the charts to your desired layout. Here’s a sample dashboard displaying the access activities:
Cleaning up
As an optional step, remember to clean up the resources used for this setup. Delete the Kinesis Data Firehose delivery stream and disable file access auditing on the Amazon FSx for Windows File Server file system.
Conclusion
In this blog post, I explored one of a wide range of analytics workflows possible using file access auditing for Amazon FSx for Windows File Server. I configured Splunk to act as a destination for Kinesis Data Firehose. I enabled file access auditing for Amazon FSx and configured it to send logs to Kinesis Data Firehose. Finally, I used Splunk to search the audit logs and present results through a dashboard.
File access auditing for Amazon FSx for Windows File Server offers a cloud-native end-user access auditing solution. File access auditing allows you to use a variety of AWS services or third-party security incident and event management (SIEM) tools to process audit events. This empowers organizations to improve and maintain their audit and security capabilities and react to threats or changing circumstances with confidence and speed.
Thanks for reading this blog post. If you have any comments or questions, please leave them in the comments section.

